
*** This blog was originally posted in April 2015. This analysis was updated in May 2022. ***
When are severe thunderstorms most likely to occur? This is a question of great interest to forecasters, researchers, and emergency management personnel.
A number of sites contain bar charts or broadly generic maps with severe weather frequency (see here and here). However, a detailed temporal climatology does not appear to exist. Therefore, I present these maps as a jumping off point for continued discussions.
The Storm Prediction Center (SPC) has an wonderful archive of past severe thunderstorm climatology. Their database was used exclusively in the development of these severe weather climatology maps.
Severe Weather Definitions
Before we get started, here is what defines "severe weather" and therefore included in the SPC database.
1) Wind gust in excess of 50 knots (associated with a thunderstorm)
2) Hail 1" or greater in diameter (>25 mm)
3) Tornado
In addition to the severe criteria, I restricted the analysis to the May - November period and from 10 a.m. to 3 a.m.
The SPC database contains hundreds of thousands of events as a series of points and lines. Each record in the database is assigned a latitude, longitude, and time of occurrence. Since an event with a beginning and ending coordinate (a line) is only assigned a single time stamp, I decided to assign the time to the beginning coordinate and treat the event as a discrete point.
Unit of Time
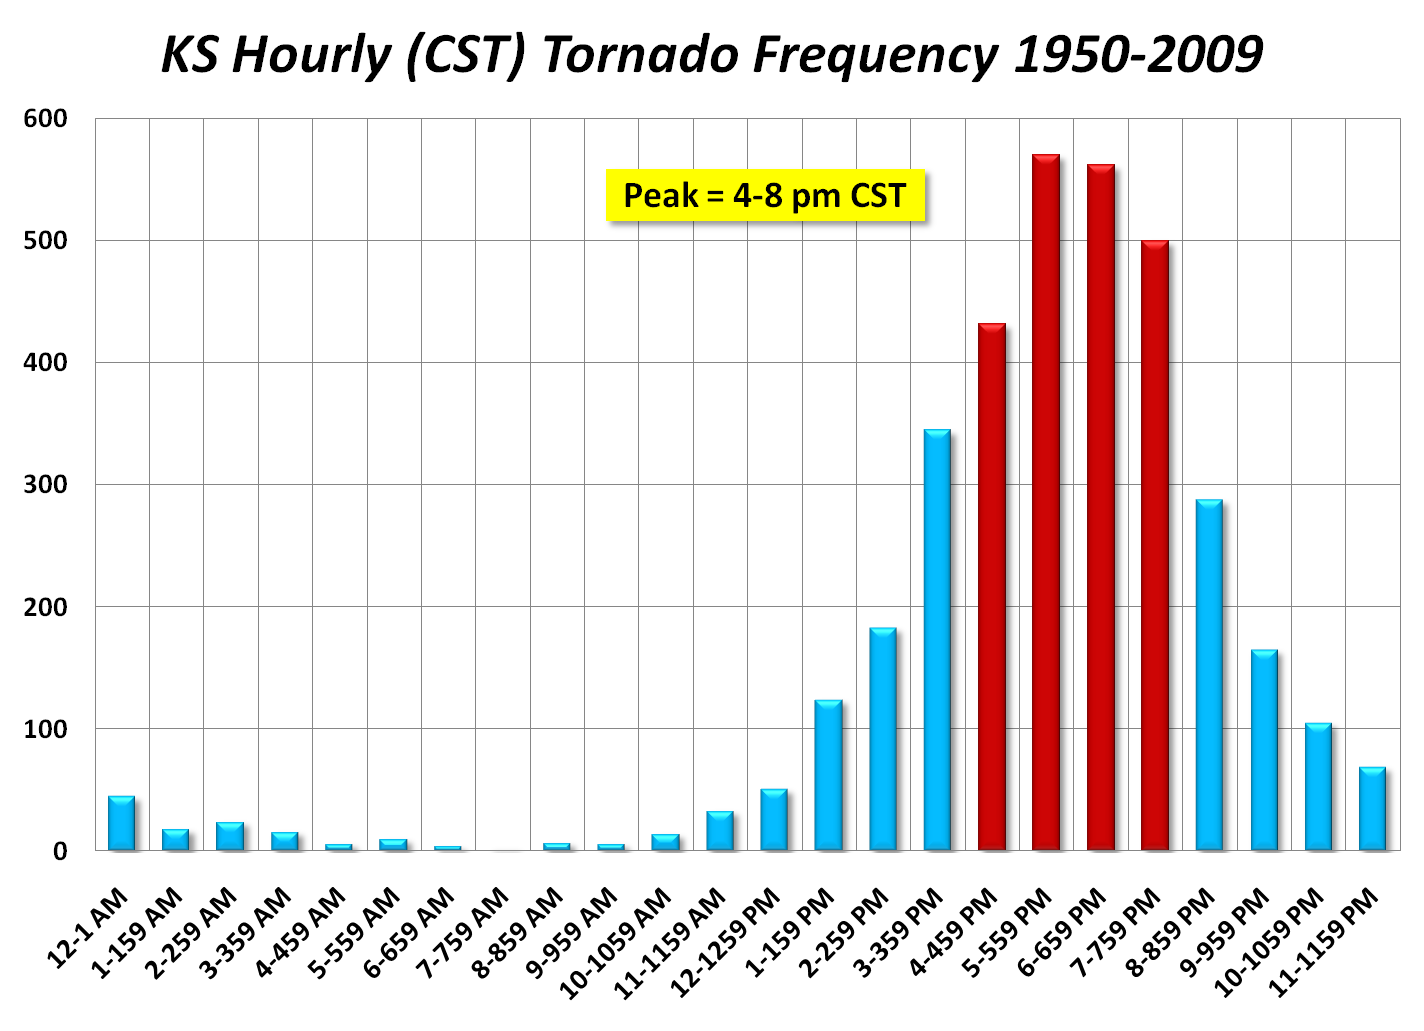
Every chart that I have come across relating severe weather to a time of day uses clock frequency. In the example from the NWS Wichita office, they determined that the 5:00 p.m. - 5:59 p.m. hour is the most likely hour to observed a tornado in their region. While this is useful information, it is not applicable to all places. Imagine two cities with an identical tornado climatology, but at opposite sides of a time zone. They have a chart that is an hour different – even though the peak may be exactly the same. Next, the time of peak solar energy is not the same from day-to-day. It changes by nearly 30 minutes over the course of a year. The Equation of Time describes the changes in the time of solar energy. Since the primary source of energy that drives severe thunderstorms is diurnal solar input, knowing the exact solar parameters for an event is crucially important.
A simple relationship exists between the longitude and the time of solar noon (when the sun is at its maximum elevation above the horizon). This value is easily computed from the date and the longitude entries in the severe weather databases. A correction based on the Equation of Time is then applied the the solar noon calculation. Finally, the solar noon time is subtracted from the event time to come up with our units. For example, if a city's unadjusted solar noon is 12:30 p.m., the Equation of Time correction for that date is -0:15, and a severe hail storm hit at 4:45 p.m., the event is computed as occurring 4.5 hours after solar noon. Therefore, severe weather times of occurrences are described as hours after solar noon.
Data Processing
Since solar energy is the main, but not exclusive, driver of severe weather, I took the liberty of removing some events. Specifically, all events in the months of December, January, and February were excluded. Also, events that occurred between 3.5 and 8.5 hours before the computed solar noon were removed. Here's why. If an event happened at 6 a.m. on a day where solar noon was computed as 12:00 p.m., did the event happen 6 hours before solar noon or 18 hours after yesterday's solar noon? This is a difficult question to answer. So, I just removed 5 hours worth of observations and made the problem go away.
For each data set (tornado, hail, and wind) I made a density grid for the entire U.S. using 35,000 meter grid cells. if a grid cell had at least 4 events during the period of record, it was kept for analysis. This leaves out most of the area west of the Rocky Mountains.
Next, an average value of the time past solar noon for all events in each grid cell was computed. In it's raw form, this makes the map look quite chaotic. To make it aesthetically pleasing, I ran a 5x5 mean filter across the data sets.
Maps
The following three maps were generated using the process described in the preceding section.

Figure 1. Average time of occurrence of all severe thunderstorm-generated wind events. Time is hours after solar noon.

Figure 2. Average time of occurrence of all large hail events. Time is hours after solar noon.

Figure 3. Average time of occurrence of all tornado events. The time is assumed to represent the point of initial tornado touchdown. Time is hours after solar noon.

Figure 4. Average time of occurrence of all severe weather events. Time is hours after solar noon.
Analysis
I was quite surprised at the time variability in Figures 1 & 2 in particular. Why are storms more likely to occur several hours later in the day in the Great Plains versus the eastern 1/3 of the U.S.? Why are severe wind events so much later in the day? I think that discrete storms that produce large hail and tornadoes tend to "evolve" into more linear wind producing features. MCSs are also more likely to get started later in the day and the distance from the Rocky Mountains in non-trivial.
Great work, Brian. Very nice indeed. Many severe wind events in the Plains are "derecho" type events, which are long-lived straight-line wind storms caused by a large and intense convectively-generated cold pool that advances rapidly, usually eastward or southeastward. The stronger the cold pool relative to the ambient environment, the stronger the winds. These events often have an evening or nocturnal peak in intensity, partly because it takes hours for the cold pool to reach maximum strength, and partly because the Great Plains low level jet intensifies in the evening as the boundary layer decouples from the air above. The southerly low level jet feeds moist, warm air into the storms, allowing them to continue intensifying as the sun goes down; so this may explain the lateness of the wind events in the Plains.
ReplyDeleteAnother aspect is that many convective systems in the Plains begin their life as storms that initiate over the high terrain of the High Plains or eastern Rockies and propagate eastward in the afternoon and evening hours; so there is a typical diurnal cycle that causes the severe storm timing to get later as you go eastward off the high terrain (up to a certain point). The very late peak in the Dakotas may be related to the fact that it's a greater distance from the Montana Rockies eastward to the low-level jet (and the most unstable air) than it is from the Colorado Rockies to the low-level jet; so in the northern Plains the wind-causing cold pool can keep intensifying late into the evening or overnight.
Hail and tornadoes are much more directly related to the intensity of the storm updrafts (than the cold pool), so these tend to peak earlier in the day.
In Florida, the vast majority of thunderstorms occur in summer (May-Sep) and are closely tied to the diurnal cycle, because there is rarely enough upper-level forcing (wind shear) to cause the storms to become organized or long-lived into the evening. When the sun goes down, the storms die quickly, so I think this explains the early peak in severe storm timing.
The patterns are fascinating and a detailed examination would make for a useful thesis or research publication!
Thanks Richard. Fantastic analysis on your part as always! I have tremendous respect for your insight.
DeleteI also wonder if isolated thunderstorms capable of producing hail and tornadoes later coalesce into a linear MCS that then produces straight-line winds greater than 50 knots. Also, if a storm produces hail and severe wind at the beginning of its existence it might only be noted in the hail category. An hour or so later, when the hail has stopped but the wind has not, it might be reported as a wind event. That would favor a later wind bias. Just a guess though.
Yes, that is definitely correct - large hail and tornadoes are generally associated with discrete storms, often rotating, i.e. supercells. As the surface-based cold pool expands over time, the mode often shifts to a quasi-linear system with a higher risk of straight-line winds.
DeleteI would imagine that the SPC database records all reported instances of each category, but there might possibly be a reporting bias that under-reports wind if hail is occurring at the same time. Interesting idea.
This comment has been removed by a blog administrator.
ReplyDeleteA good point he raised here about Website Hosting! .
ReplyDelete